


 MODEL DISPLAY screen explanation / How to display telemetry etc. on the radio screen
This section describes how to use MODEL DISPLAY screen of OpenTX / EdgeTX radio.
このページを日本語で見る
Table of contents
Custom telemetry screen

MODEL DISPLAY screen allows you to specify what to display on this custom telemetry screen.

Display type of custom telemetry screen
Display type of the custom telemetry screen can be selected from the following three types.
Display data numerically.
In the case of a radio with a screen resolution of 128x64 pixels, 3 rows x 2 columns, total 6 data can be displayed.
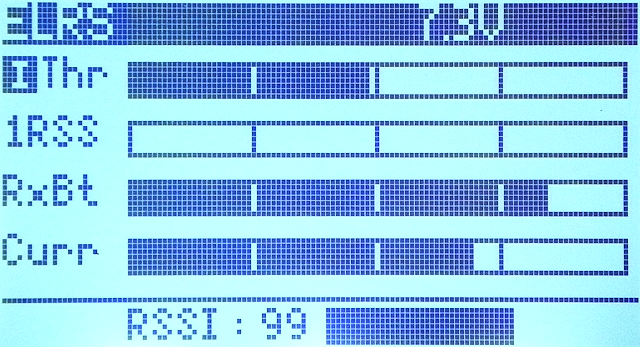 Display the data as a bar graph.
In the case of a radio with a screen resolution of 128x64 pixels, 4 data can be displayed.
The 5th line shows RSSI.
Display the data as a bar graph.
In the case of a radio with a screen resolution of 128x64 pixels, 4 data can be displayed.
The 5th line shows RSSI.
Start the Telemetry type Lua script stored in radio's microSD card and display execution result. The screen changes depending on Lua script that is started. Lua scripts should be stored in "/SCRIPTS/TELEMETRY" folder of microSD card in advance.
Lua script for beginners
How to operate MODEL DISPLAY screen
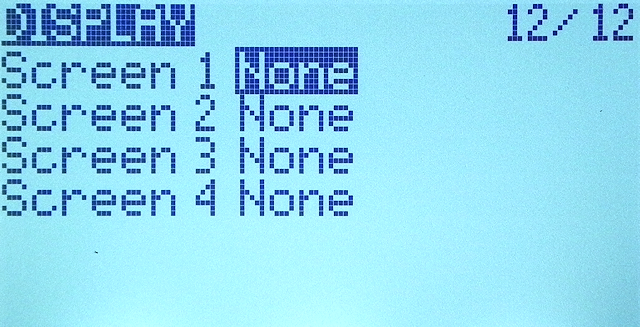 If you open "DISPLAY" screen from "MODEL menu", the screen will look like this.
Move the cursor to [None] displayed to the right of "Screen 1" to "Screen 4" and press [ENTER] key to select
display type of the custom telemetry screen
.
If you specify "None" for the display type, the screen will not be displayed.
If you open "DISPLAY" screen from "MODEL menu", the screen will look like this.
Move the cursor to [None] displayed to the right of "Screen 1" to "Screen 4" and press [ENTER] key to select
display type of the custom telemetry screen
.
If you specify "None" for the display type, the screen will not be displayed.
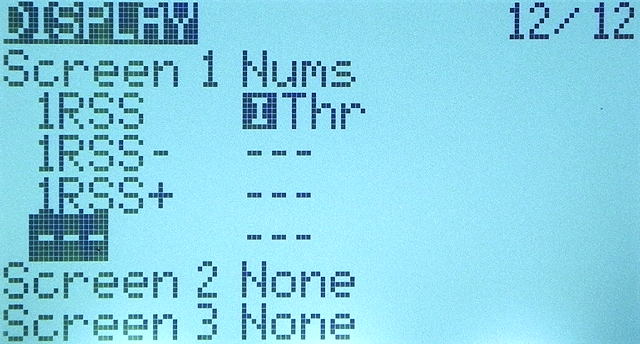 If you select "Nums (Numbers)" as the display type, screen will look like this.
You can select data to be displayed on custom telemetry screen by moving cursor to "---" under string "Screen 1" to "Screen 4" and pressing [ENTER] key.
If you select "Nums (Numbers)" as the display type, screen will look like this.
You can select data to be displayed on custom telemetry screen by moving cursor to "---" under string "Screen 1" to "Screen 4" and pressing [ENTER] key.
You can specify data to be displayed includes "inputs" defined on INPUTS screen , physical devices such as sticks, switches, and dials (Pot: Potentiometer), MAX (a constant that always returns 100), Cyclic (defined on the Heli Setup screen), trim switches , channel values, global variables , time, timer , telemetry , etc.
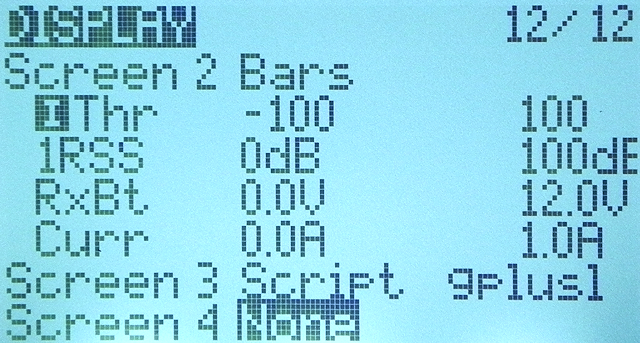 If you select "Bars" as the screen display type, the screen will look like this.
You can select data to be displayed on custom telemetry screen by moving cursor to "---" under string "Screen 1" to "Screen 4" and pressing [ENTER] key.
If you select "Bars" as the screen display type, the screen will look like this.
You can select data to be displayed on custom telemetry screen by moving cursor to "---" under string "Screen 1" to "Screen 4" and pressing [ENTER] key.
Specify one data per line. Specify the name of the data in the first field, the minimum value to display in the second field, and the maximum value to display in the third field. A bar graph displays between the minimum and maximum values.
To know more about How to Fly Hobby Drone
To know more about iPhone